Graphs of Equations
Graph the equation
First, find values of the variables that satisfy the equation. Since the equation expresses x in terms of y, it is easier to assign a number to y, and then compute the corresponding value of x. Any real number can be assigned to y. For example, you may assign –4, –3, –2, –1, 0, 1, 2, 3, and 4 to y. After that, compute the corresponding values of x.
If then
If then
If then
If then
If then
If then
Tabulate the results.
| x | 16 | 9 | 4 | 1 | 0 |
| y | −4 | −3 | −2 | −1 | 0 |
| x | 1 | 4 | 9 | 16 |
| y | 1 | 2 | 3 | 4 |
Next, plot the points that correspond to the 9 ordered pairs in the table. Then draw a smooth curve passing through all the points. Refer to the figure below.
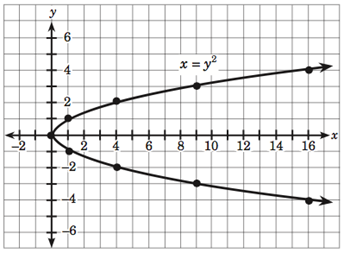
The curve that passes through the points is called a parabola.