Graphs of Equations
The following are the steps in graphing an equation in the variables x and y on a coordinate plane:
1. Tabulate values of x and y that satisfy the equation.
2. Plot the points that correspond to the ordered pairs
obtained in step 1.
3. Draw the line or curve passing through the points.
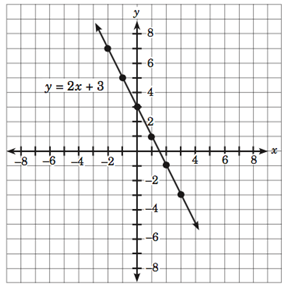
Graph the equation
First, tabulate the values of x and y that satisfy the given equation. You may assign any real number to x such as –2, –1, 0, 1, 2, and 3. Then, for each value assigned to x, compute for the corresponding value of y.
If then
If then
If then
Tabulating the obtained information gives you the following values:
| x | −2 | −1 | 0 |
| y | 7 | 5 | 3 |
| x | 1 | 2 | 3 |
| y | 1 | −1 | −3 |
Then, plot the points that correspond to the ordered pairs Plot and Next, connect the points. The plotted points form a line. Label the line with the equation.
The figure below shows the graph of the line.