Graphs of Equations
The graph of an equation in two variables x and y is the set of all points on a plane that satisfies the equation. In the preceding example, the graph of the equation is the line shown in the figure.
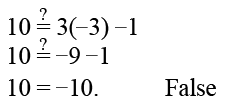
Which of the points and is on the graph of the equation
To check if point is on the graph of substitute and to the given equation. You will get the following:
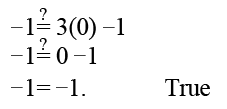
Since the coordinates of point A make the equation true, point A is on the graph of Point is not on the graph of since substituting and to the equation yields a false statement, as shown below.