Experiments and Sample Spaces
Tree Diagram
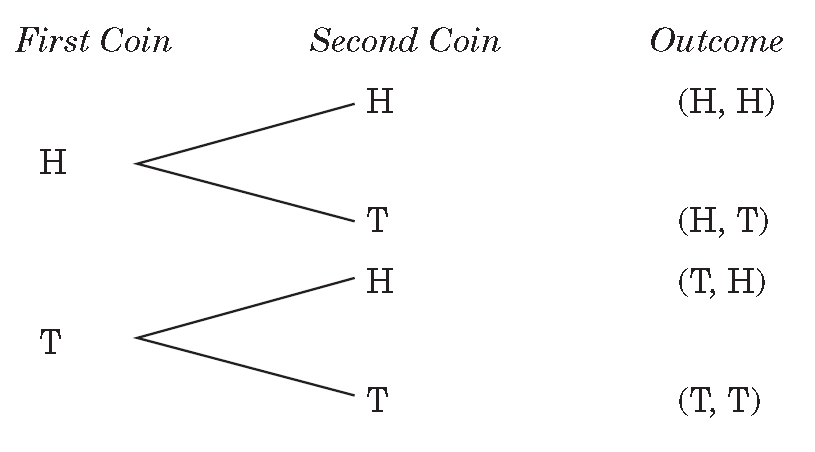
A tree diagram is a graphic representation used to list all the possibilities of a sequence of operations in an experiment.
Study the tree diagram for tossing two coins in the figure shown below. If you follow along the branches of the tree diagram, you will obtain the possible outcomes listed, where H represents a head and T, a tail.

The tree diagram shows that there are four possible outcomes for the experiment of tossing two coins.
