Graphs of Linear Inequalities in Two Variables
Example 3
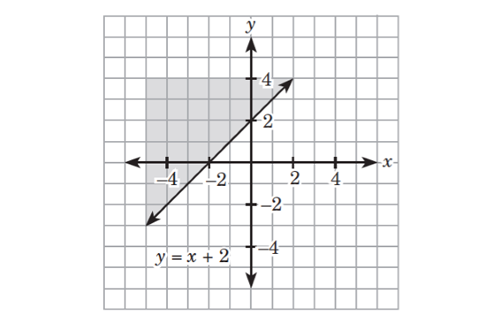
Graph the inequality
Solution
The equation of the boundary line is Since the inequality symbol is the boundary line is a solid line.
Using as the test point, the result is which is false.
Therefore, the required graph is the region on the side of the boundary line that does not include the point as shown in the figure below.