Graphs of Linear Inequalities in Two Variables
Example 2
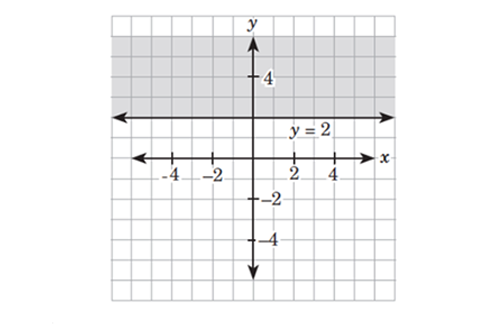
Graph the inequality
Solution
The equation of the boundary line is whose graph is a horizontal line that is 2 units above the x-axis. Make this line solid since the inequality symbol is
Using as the test point, the resulting inequality is which is false.
Thus, the graph of is the region on and above the line as shown in the figure below.