Graphical Method of Solving Systems of Linear Inequalities in Two Variables
To solve a system of linear inequalities graphically, graph each inequality of the system on the same set of axes, and then determine the region where their graphs overlap. Such region represents the solution set of the system.
Graph the solution set of the following system of linear inequalities:
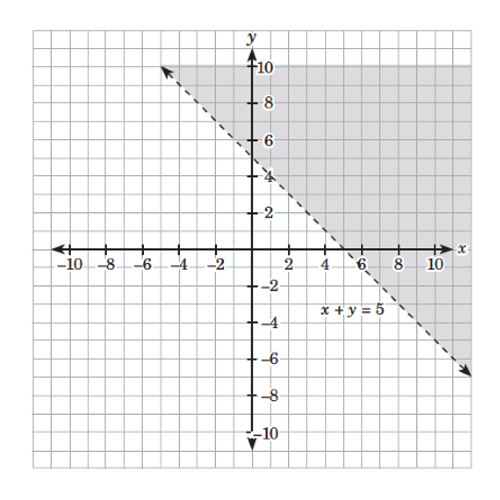
First, graph each linear inequality of the given system. The graph of has a dashed boundary line with the equation
Using as the test point, you will get which is false. Hence, the graph of is the region on the side of the boundary line not containing the point Refer to the following figure:
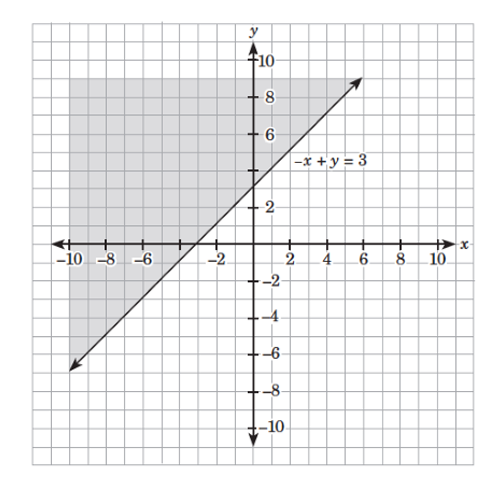
For the boundary line is a solid line with the equation Using again as the test point, you will obtain which is false. Thus, the graph of is the region that does not contain the point and includes the boundary line, as shown in the following figure:
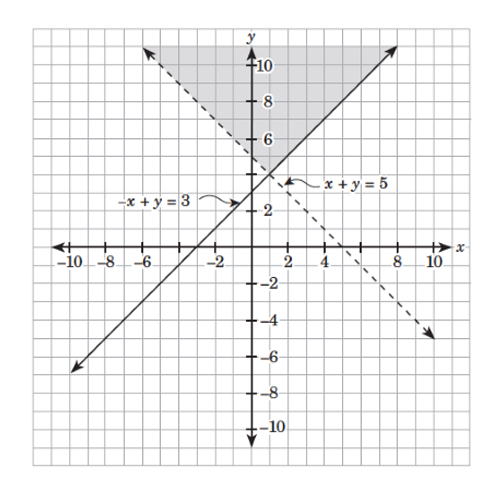
Combine the two preceding graphs on the same set of axes and shade the region where they overlap. The resulting region (which is shown in the figure below) is the solution set of the given system of linear inequalities.