Graphs of Linear Inequalities in Two Variables
Example 1
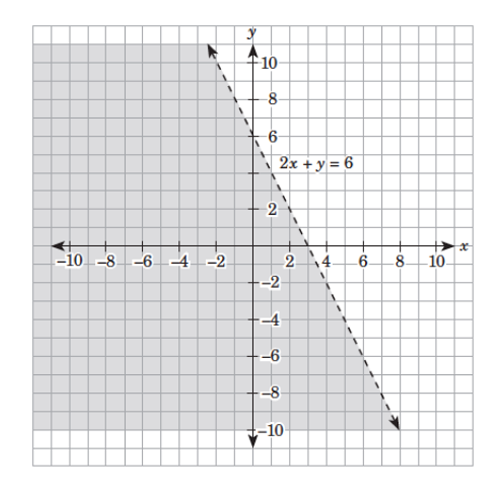
Graph the inequality
Solution
First, graph the boundary line whose equation is Since the inequality symbol is <, the boundary line is a dashed line.
Then, to make the computation easier, choose as the test point; that is, substitute 0 for x and 0 for y in the inequality
| True |
Since satisfies the given inequality, shade the region on the side of the boundary line that includes the point Refer to the shaded region in the figure below for the graph of