Slope of a Line
Example
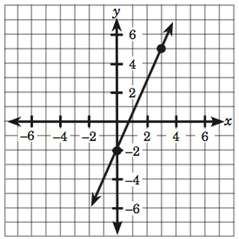
Graph the line whose y-intercept is –2 and whose slope is
Solution
Since the desired line has –2 as y-intercept, the line passes through the point From this point, locate a second point using the given slope of the line, which is Follow the steps in the preceding example. The graph is shown in the figure below.