Slope of a Line
In the preceding example, it does not matter which of the two given points is assigned as or To illustrate this, let and that is, and Then the slope of the line is given by
The figure below shows the line that passes through the points and
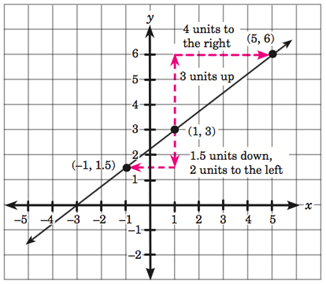
You learned that the slope (which, in this case, is ) is the ratio of the rise to the run. This means that to go from one point to another on the line above, every vertical change of 3 units (which is the rise) corresponds to a horizontal change of 4 units (which is the run).
Notice that when a line rises from a left to right, it has a positive slope. The next example shows a line with a negative slope.