Slope of a Line
Example 1
The slope of line l is What is the slope of line n given each condition?
a. Line n is parallel to line l.
b. Line n is perpendicular to line l.
Solution
a.
b.
Example 2
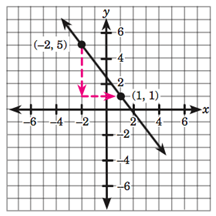
Graph the line that passes through the point and whose slope is
Solution
First, plot the point Then use the given slope, which is to find a second point on the line. Here is one way to do this. From go 4 steps down and then 3 steps to the right. You will reach point The line connecting the points and is the required line. The graph is shown in the figure below.