Graphical Method of Solving Systems of Linear Inequalities in Two Variables
Example 2
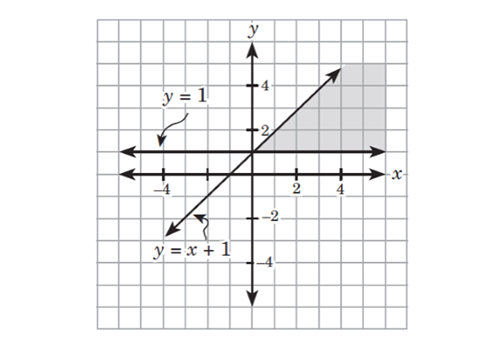
Graph the solution set of the system of linear inequalities below.
Solution
You can graph each inequality of the system on the same set of axes.
The graph of is the region on or below the boundary line
The graph of is the region on or above the boundary line
Hence, the solution set is the shaded region shown in the following figure: