Basic Concepts on Linear Functions
Example 3
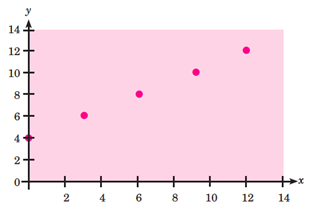
Determine the rule or equation represented by the scatter plot shown in the figure.
Solution
The plotted points in the figure progress in a line; that is, they form a linear pattern. Hence, the equation of such linear pattern is in the form Notice that whenever x increases by 3, y increases by 2; hence, the slope of the linear pattern is equal to Also, when Thus, and the equation that describes the linear pattern is: