Types of Graphs
There are two main types of graphs: line and bar. Usually, a graph follows a data table. The numerical data in the table can be transformed into line and bar graphs.
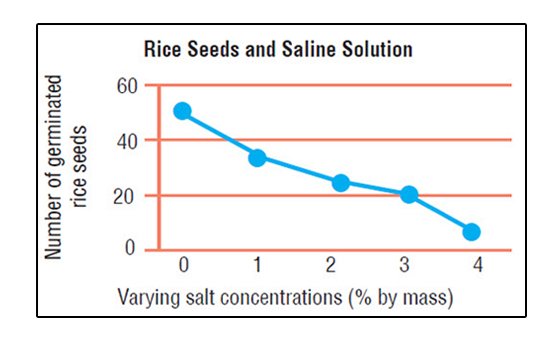
Note how the data in the table is converted into a line graph.
| Salt Concentrations (% by Mass) | Average Number of Germinated Rice Seeds |
|---|---|
| 0.0 | 50 |
| 1.0 | 37 |
| 2.0 | 25 |
| 3.0 | 18 |
| 4.0 | 10 |
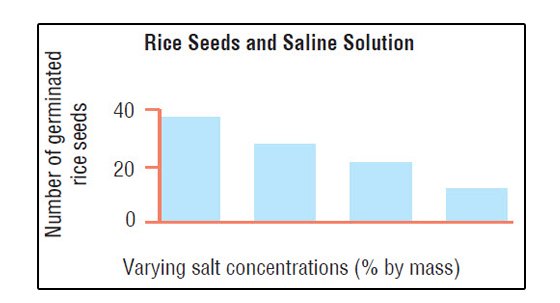
Note how the same data is converted into a bar graph.