Types of Graphs
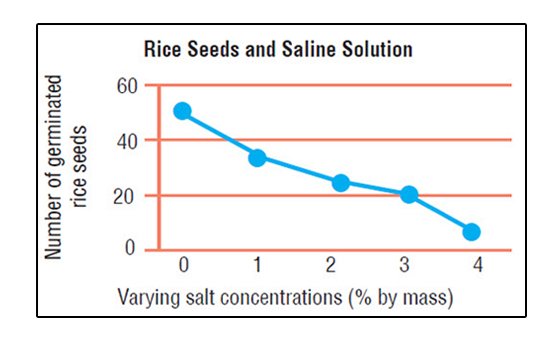
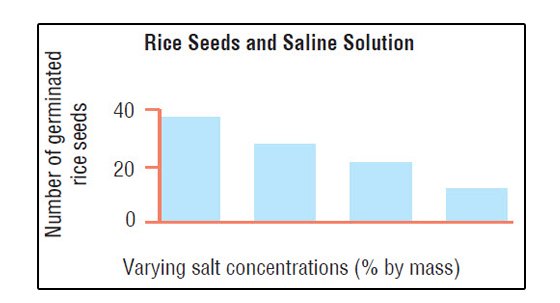
A comparison of both graphs will show that an inverse relationship exists between the independent variable (salt concentrations) located in the horizontal line or x-axis and the dependent variable (number of germinated seeds) located in the vertical line or y-axis wherein the higher the salt concentration in a solution, the lesser the number of germinated seeds.