Types of Graphs
Line Graph
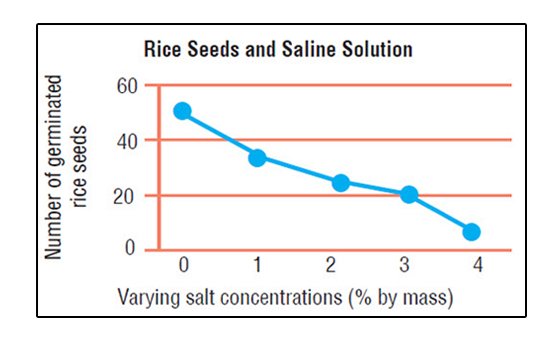
On the other hand, when two variables are inversely related, the value of the independent variable increases while the value of the dependent variable decreases as can be seen in the image below.
Another example of an inverse relationship between variables is seen in an increase on the pressure on the volume of gas confined in a tank such as liquefied petroleum gas (LPG) while the temperature of the surroundings remains constant. Greater pressure exerted on the gas will cause the volume of the gas to be compressed in the tank; as the pressure increases, the volume decreases.
The independent variable is the pressure while the dependent variable is the volume of gas. In a line graph, the line for an inverse relationship is in a downward direction toward the x-axis.
Both independent and dependent variables can be quantitative and their numbers are plotted on the horizontal x- and vertical y-axes of a graph. The values of the independent variable are plotted on the x-axis, while the values of the dependent variable are plotted on the y-axis.
When assigning numbers to both axes, the assigned numbers are of equal intervals. These numbers are called scales.