Types of Graphs
Bar Graph
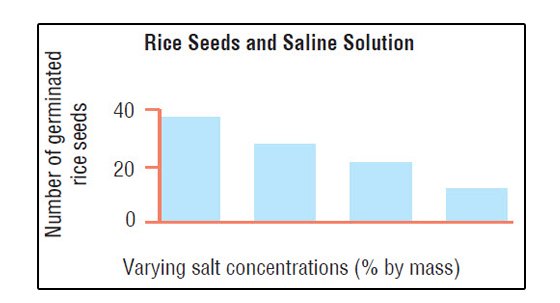
A bar graph consists of rectangular bars that differ in height or length according to their value or frequency of occurrence. In contrast to the line graph, this type of graph illustrates a change in magnitude but not in direction.
A bar graph can be presented in either horizontal or vertical form, depending on the data to be represented.
In a horizontal bar graph, the bars are placed in the x-axis. In the vertical bar graph, the bars are placed on the y-axis. The independent variable in a bar graph is also placed on the x-axis while the dependent variable is placed on the y-axis.