Vertical Line Test
A graph is a tool used to visualize the behavior of a certain function. The graph of a function f is the graph of its ordered pairs in the rectangular coordinate system. You can graph a function by plotting its ordered pairs and drawing a line or a smooth curve through them.
Graph
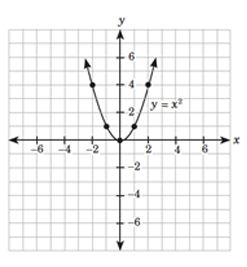
The graph of is the graph of Construct a table of ordered pairs using the x-values –2, –1, 0, 1, and 2. For convenience, use integer values of x.
|
Value of x |
Value of |
Ordered Pair or |
| –2 | ||
| –1 | ||
| 0 | ||
| 1 | ||
| 2 |
Now, plot the five points and draw a smooth curve through them. Note that the graph of f extends indefinitely to the left and to the right. Refer to the graph below.