Acceleration
Sample Problems
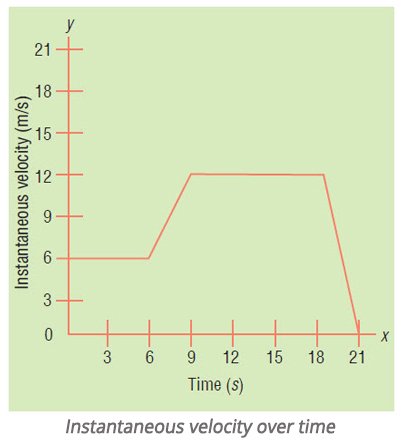
- Describe the motion of the car plotted on the instantaneous velocity-time graph.
- Solution
- The horizontal line in the v-t graph means that the car’s velocity does not change, so there is no acceleration. The line sloping upward shows that the acceleration is positive. The line sloping downward means that the acceleration is negative. The graph therefore illustrates that the car moves at constant velocity of 6 m/s, then accelerates at 2 m/s², then moves at a velocity of 12 m/s in 9 s, and finally decelerates at 4 m/s² until it comes to rest.