Speed
Speed can also be represented using a graph. For example, a jeepney starts from a certain place and travels a distance of 4 km in 5 min and 8 km in 10 min. In half an hour, it has traveled 24 km. The following graph shows that the speed from each point does not change drastically.
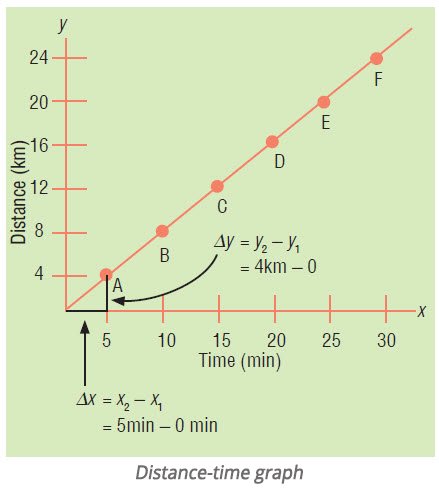
Speed may be obtained by taking the slope of the line on the graph. The slope is the ratio of the change in y-axis to the change in x-axis. This is shown in the equation
\[
m = \frac{\Delta y}{\Delta x},
\]
where m represents the slope, Δy is equal to y2 – y1, and Δx is equal to x2 – x1.